data last updated 2025 November
AI-driven prices, trends, and investment data for Marbella
Market insights, price per m², rent ranges, and ROI analysis will appear once data verification is complete.
| Investment Amount | Monthly Return | Annual Return | ROI |
|---|---|---|---|
| €10,000 | €52 | €621 | 6.2% |
| €20,000 | €104 | €1,242 | 6.2% |
| €30,000 | €155 | €1,863 | 6.2% |
| €50,000 | €259 | €3,105 | 6.2% |
| €100,000 | €518 | €6,210 | 6.2% |
| €200,000 | €1,035 | €12,420 | 6.2% |
| Property Type | Average Price | Monthly Rent | Rental Yield |
|---|---|---|---|
| 1 Bedroom Apartment | €226,929 | €1,202 | 6.4% |
| 2 Bedroom Apartment | €308,753 | €1,589 | 6.2% |
| 3 Bedroom Apartment | €380,356 | €1,995 | 6.3% |
| 4+ Bedroom Apartment | €180,302 | €1,272 | 8.5% |
| apartments | €229,103 | €1,137 | 6.0% |
| Penthouse | €824,087 | €3,504 | 5.1% |
| Studio | €179,704 | €832 | 5.6% |
| Townhouse | €463,787 | €2,515 | 6.5% |
| Villa | €836,963 | €3,676 | 5.3% |
| Metric | Current Value | YoY Change |
|---|---|---|
| Average Property Price | €394,723 | +7.0% |
| Average Monthly Rent | €3,012 | +7.5% |
| Rental Yield | 9.2% | +2.0% |
| Price per m² | €5,214 | +3.7% |
| Properties Sold YTD | 383 | +9.1% |
| Average Days on Market | 60 days | -5% |
Returns are calculated based on aggregated market data and do not represent guaranteed outcomes. Provided numbers is not an advice for investment.
Key insights into local investment infrastructure
Our top-performing properties selected by investment experts
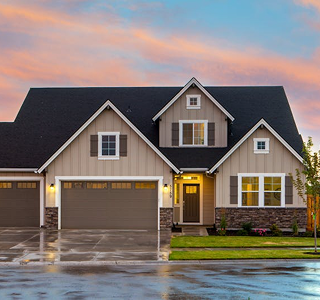