Handpicked for Maximum Return
Our top-performing properties selected by investment experts
test
adsfasdf...
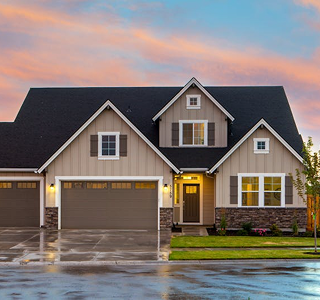
2 Bedroom Apartment • 1 bedrooms
Property Price
€4 343 434
Annual Return
€2 664